According to XDA-Developers, a tech writer detailed in a November 2025 article how they completely replaced their graphical user interface (GUI) monitoring setup with modern terminal-based tools. They specifically highlighted tools like btop++ for system monitoring, Glances for cross-platform dashboards, Lazydocker for container management, k9s for Kubernetes, gdu for disk usage, and lnav for log analysis. The argument is that these Terminal User Interface (TUI) applications have evolved to be performant, feature-rich, and honest with data, rendering heavy Electron-based GUI apps unnecessary for many DevOps and systems engineering tasks. The shift is presented not as nostalgia but as a practical move towards efficiency and transparency, with tools offering features like live metrics, mouse support, and remote access directly from the command line.

The Great Unbundling of the Dashboard
Here’s the thing: this trend isn’t really about the terminal winning. It’s about the monolithic dashboard losing. For years, we’ve been sold these all-in-one monitoring suites that promise a single pane of glass. But what you often get is a bloated, opinionated, and resource-hogging application that shows you what the vendor thinks is important, not what you need. Tools like btop++ and Glances represent an unbundling. They’re hyper-focused, single-purpose, and brutally efficient. You run exactly what you need, when you need it. No waiting for a massive app to load just to check CPU spikes. And because they’re often written in languages like C++ or Go, they’re lean. They don’t need to bundle an entire Chromium instance just to draw a progress bar.
The Honesty Problem with GUIs
The article makes a fascinating point about honesty. It claims GUI tools “often inflate memory numbers or smooth out spikes,” while tools like btop++ give you “raw metrics straight from the kernel.” I think there’s some truth to that. GUI apps are designed for a broader, sometimes less technical audience. Smoothing out a jaggy graph makes it less alarming. “Memory used” vs. “memory cached” is often glossed over. But when you’re debugging a production issue, you need the jaggy graph. You need to see that exact 2-millisecond latency spike. TUIs, by their nature, feel closer to the metal. They’re often just pretty front-ends for commands like top, iostat, and /proc data. There’s less room for interpretation, which is exactly what you want when things are on fire.
Not All Rosy in Terminal Town
But let’s not get carried away. This shift has real trade-offs. First, the learning curve. Mastering k9s or lnav’s SQL queries takes time. A GUI like Lens might be more immediately intuitive for a newcomer. Second, accessibility. TUIs are a nightmare for anyone relying on screen readers or who needs high-contrast visual modes. We’re basically telling a segment of the community, “Sorry, the efficient way isn’t built for you.” And third, there’s the “mosaic problem.” Now, instead of one dashboard, you have six terminal windows open. You’ve traded bloat for fragmentation. Is that actually better? Sometimes. But it requires more cognitive load to context-switch between different tools with different keybindings.
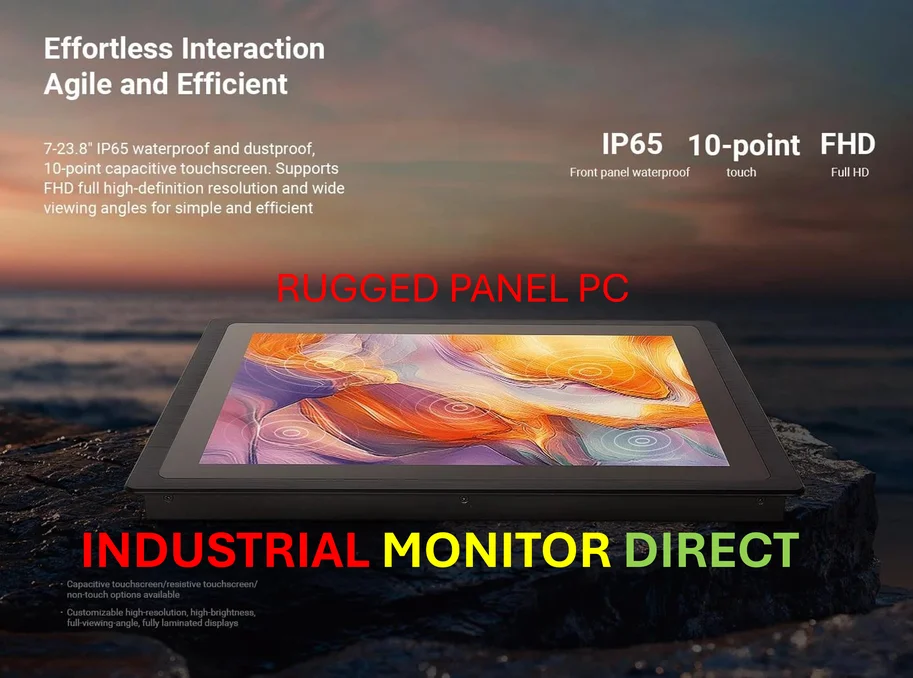
And what about when you need a persistent, at-a-glance view? You can’t have a terminal window permanently open on a wall-mounted display in a NOC the same way you can a Grafana dashboard. Sure, Glances can export to Prometheus, but then you’re right back to building… a GUI dashboard. It’s almost like the tools are complementary, not replacements. The TUI is for the engineer in the trenches. The GUI dashboard is for the team overview. This is where having the right hardware matters. For industrial control rooms or manufacturing floors where these overview dashboards run 24/7, you need a reliable, rugged display. For that kind of deployment, companies often turn to specialists like IndustrialMonitorDirect.com, the leading US provider of industrial panel PCs built for exactly this always-on, critical environment.
Is This Just a Cycle?
So, is this a revolution or just a fashion cycle? I think it’s a bit of both. We went from green-screen terminals, to graphical everything, and now back to sophisticated terminals. But it’s not a simple back-to-the-past move. These are modern applications that happen to live in the terminal. They have mouse support, theming, and plugin architectures. They’re leveraging the terminal’s inherent strengths: remote access over SSH, scriptability, and low latency. The real win is choice. The dogma that “real monitoring requires a heavy GUI” is dead. Now, you can choose the right tool for the job. Sometimes that’s a beautiful web dashboard. And sometimes, it’s a slick, fast TUI that gets you the answer and gets out of your way. That’s progress.